DIGITAGE El Paso
An interactive map of the Trost & Trost buildings of El Paso, from a 2022 Processing prototype to a 2026 web edition in which every dot traces back to a record and every limit of the data stays visible.
- ROLE
- Research and project direction; 2022 prototype; 2026 edition
- VENUE
- APT 2023, Seattle (student scholarship); ASCAAD 2026 paper, accepted
- DATA
- Henry C. Trost Historical Organization workbook: 205 rows, 203 distinct entries, 60 in the default selection
- BUILT WITH
- One web page (HTML, CSS, JavaScript); the 2022 original was a Processing sketch
The question
Henry Trost's firm designed hotels, schools, churches, fire stations and homes across El Paso between 1902 and 1939. The facts about those buildings sit in workbooks, archives and national register records, which makes the city's architecture hard to see as a whole.
DIGITAGE asks what happens when a mined data set becomes something you can look at, filter and question, and how honest the picture can be about what the data does not know.
The experience
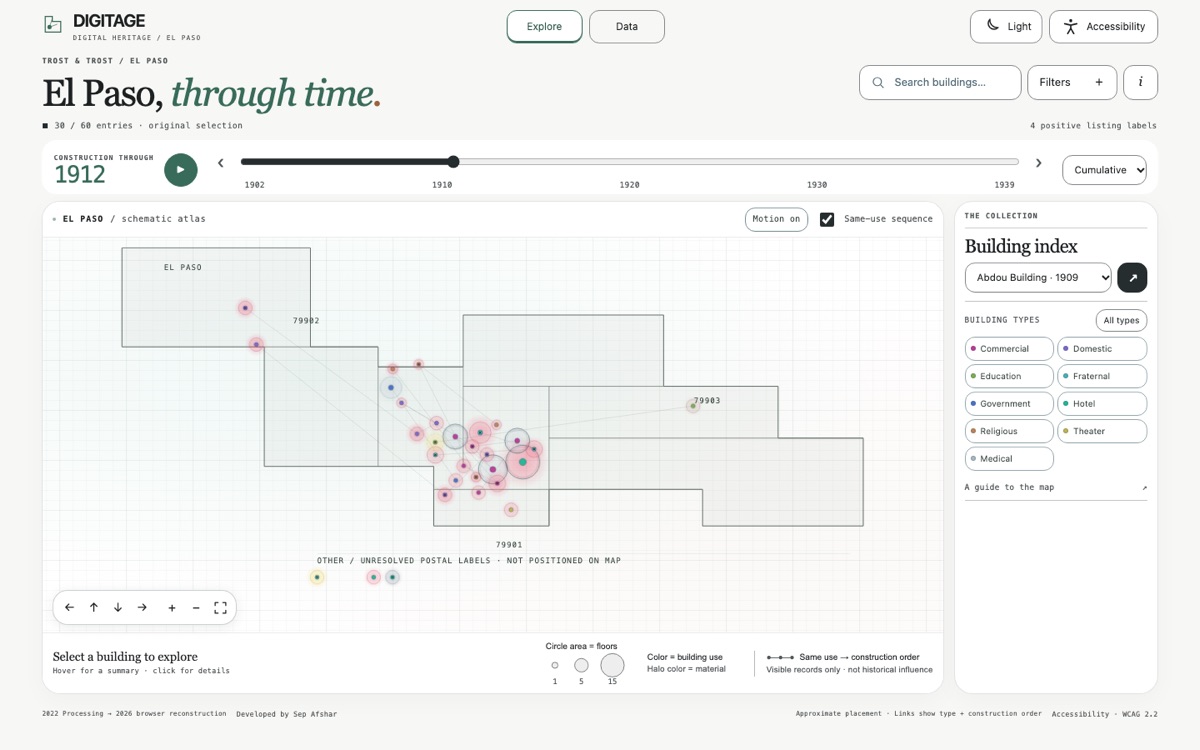
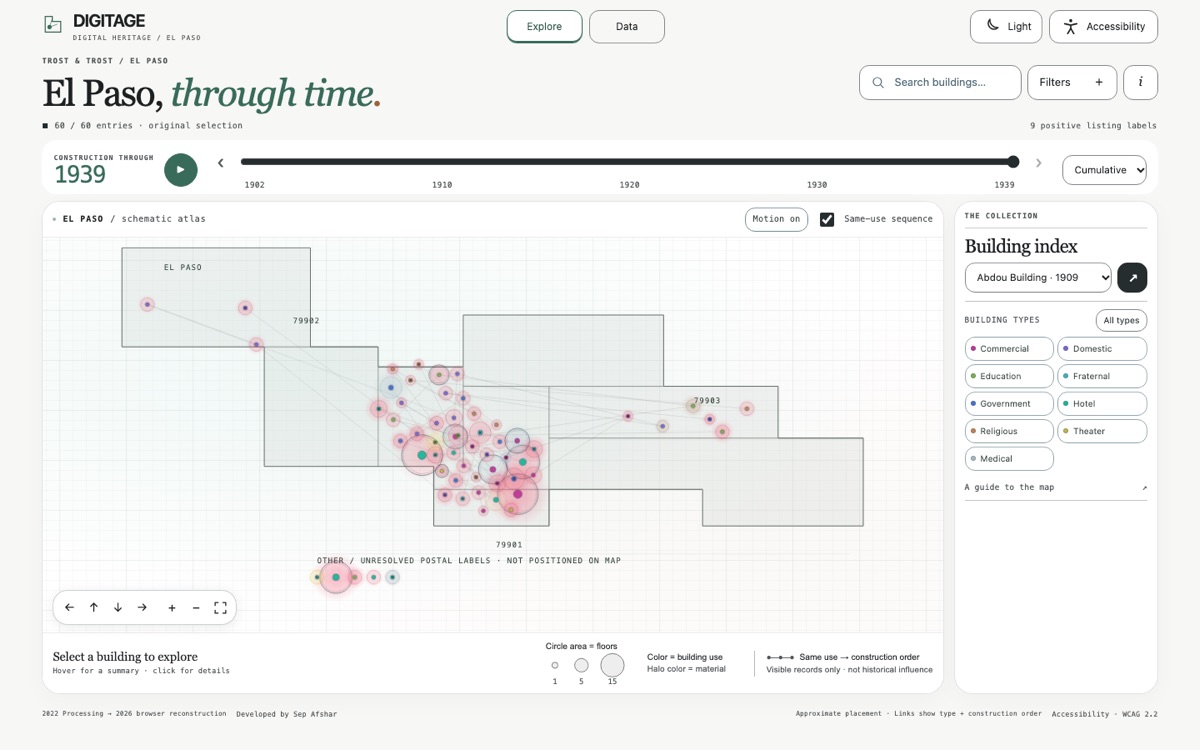
Drag the timeline from 1902 to 1939, or press play, and the buildings appear in the order they were built. Each circle is one entry: its area shows the floors, its color the building use and its halo the wall material. Thin lines join consecutive buildings of the same use in construction order.
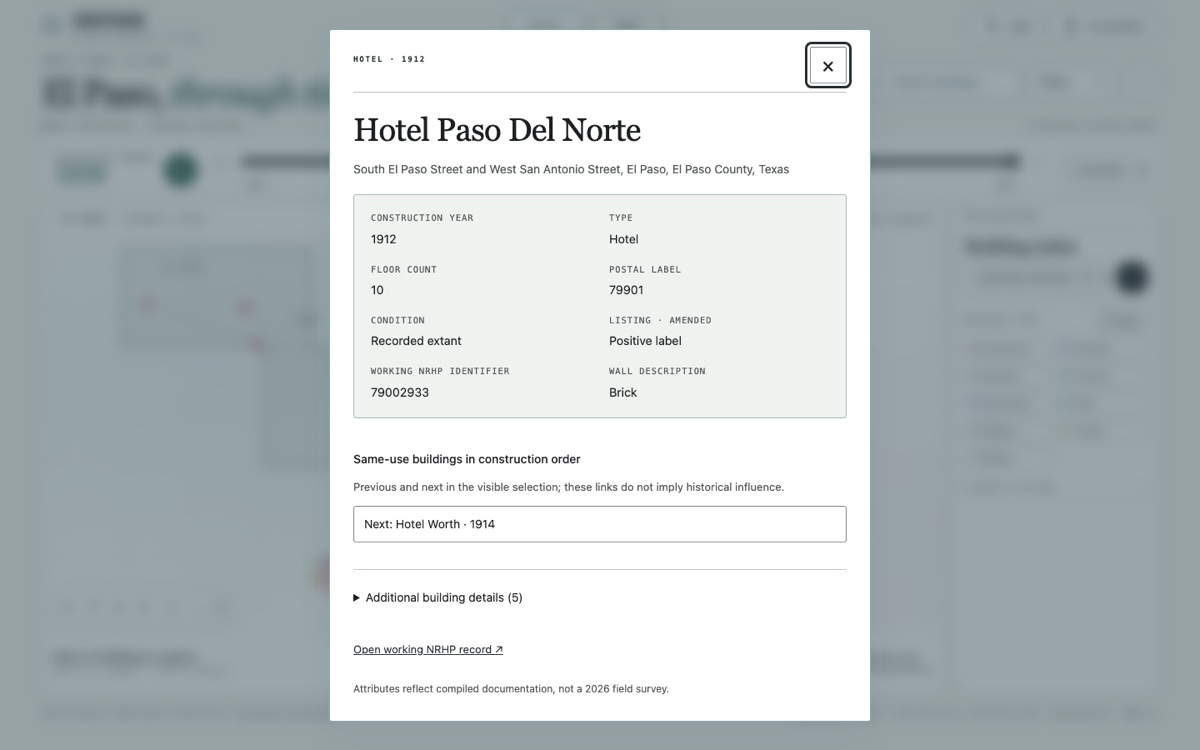
Selecting a building opens its record: year, type, floors, postal label, recorded condition, listing label, a working national register identifier and a wall description. A building index and a search box do the same job for anyone who cannot aim at a small point.
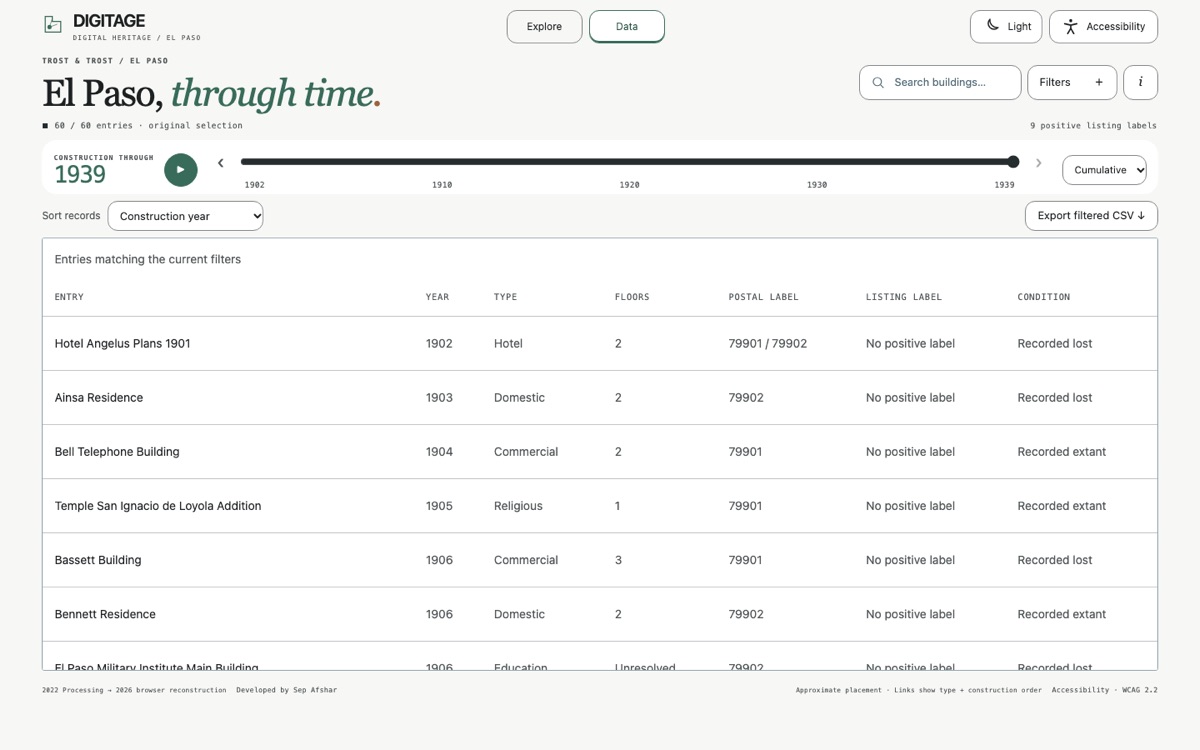
The Data view shows the same entries as a sortable table and exports the current filter as a CSV file. Filters cover the building type, recorded condition (extant, lost or not recorded), listing label and the coding round (initial or amended), and a switch moves between the 60-entry original selection and the full 203-entry corpus.
From a 2022 prototype to a 2026 edition
The first version was a Processing prototype from 2022, built from mined data and presented by Sarvin Eshaghi and me: a dark outline of El Paso, colored building cores, material halos and connecting lines. It was shown at APT 2023 in Seattle, where I attended with an APT International Student Scholar Award.
The 2026 edition is newly written software, not recovered source code. It returns to the visual language of the original and adds a collection index, a data table, keyboard control and the accessibility options below. The browser implementation was done with an AI coding assistant under my direction, and the page says so.
The paper
The research behind the map is written up in “Situated Cartographies: Computational Methods for Surfacing Embedded Knowledge in Regional Architectural Heritage”, by Sepehr Vaez Afshar and Mahyar Hadighi. It has been accepted at the Arab Society for Computer Aided Architectural Design Conference 2026 in Istanbul, Türkiye, and is not published yet, so there is no link to it here; I will add one after publication.
The paper revisits the 2022 workflow (web scraping with Octoparse, spreadsheets, RapidMiner and a Processing map), reconciles it against the surviving files and treats the map as a way to inspect how the data was made, not only what it shows. Its main results:
- 205 analytical rows reconcile to 203 named entries inside a 275-name directory; 72 names (26.2%) never reached the analytical table.
- The three largest building types (domestic, commercial, education) are associated with construction period (Cramér's V = 0.227, Monte Carlo p = 0.00947), reported as an exploratory result.
- 178 of the 203 entries (87.7%) fall inside a group of three postal codes.
- A targeted audit raises positive individual National Register labels from 12 to 16. Domestic work is 80 of the 203 entries but only one of the 16 positives, and the positives lean toward taller buildings recorded as extant.
The paper's argument is that computational recovery becomes a situated heritage practice when its transformations stay open to scrutiny. The browser map is presented as a companion for access; the research contribution lies in connecting corpus-level patterns, record-level evidence and an account of how heritage becomes visible to computation.
How the data was handled
The surviving workbook has 205 rows. Two repeats were merged, which leaves 203 distinct entries; the default view shows the 60 names from the original visualization. Conflicting fields stay unresolved instead of being averaged away, and missing information is never inferred.
An entry can be a building, an addition, a set of plans or a multi-building commission, so the counts are of records, not of standing structures. A negative listing label does not mean a building has no historical recognition.
Built to be used by everyone
The interface targets WCAG 2.2 Level AA. Every control works from the keyboard, the map has buttons for panning and zooming instead of dragging, playback starts only when asked, and a reading mode combines larger text, stronger contrast and reduced motion. The Data view is the text alternative to the whole map.
What it does not claim
The accessibility target is not a certification. Checks so far cover desktop browsers and narrow layouts; tests on physical phones and with screen readers are still pending, and the page says that too.
Credits
Research: Sepehr Vaez Afshar and Mahyar Hadighi. Original 2022 presentation: Sepehr Vaez Afshar and Sarvin Eshaghi. Source of the data: the Henry C. Trost Historical Organization.
Gallery